QDirWeiGraph
Plot Directed Weighted Graphs
QDirWeiGraph is a Qt C++ based program able to draw directed weighted graphs from XML files.
Available actions :
- Create/Save/Open graphs with XML format. Create and modify arrows
- Move nodes. Choose node labels.
- Set a threshold
- Export as .svg
Sources : QDirWeiGraph on GitHub
Binaries : QDirWeiGraph binaries on GitHub
Help
QDirWeighGraphs is a tool to create, save and plot weighted directed graphs made with Qt C++. It is made to have good rendering while a graph has many links between its nodes. With QDirWeighGraphs, you can do some basic actions, for example you can export to .svg, change scale, modify arrow value, move nodes (mouse-action), set a threshold.
For any remark or question, please send me an e-mail at francois.deloche@outlook.fr
Graph format
QDirWeighGraphs open and save graphs as .xml files. Graph files follow the structure above :
<?xml version="1.0" ? >
n is the number of nodes. Nodes id are allways 0-(n-1). "x" and "y" are nodes coord (0-->100). ScaleMax, labels and Title are optional. If a node or all nodes are not specified, QDirWeighGraphs will place it automatically on a circle.
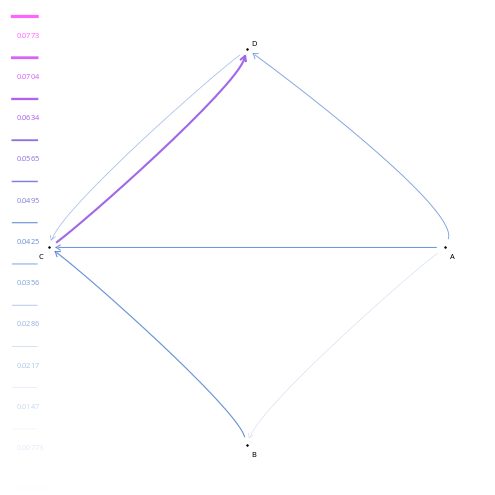
Result :
<Graph n="4" Title="Title">
<Nodes>
<Node id="0" Label="A" x="90" y="50" />
<Node id="1" Label="B" x="50" y="90" />
<Node id="2" Label="C" x="10" y="50" />
<Node id="3" Label="D" x="50" y="10" />
</Nodes>
<Arrows><Arrow From="0" To="1" Value="0.0171911707593" />
<Arrow From="0" To="2" Value="0.0408503376768" />
<Arrow From="1" To="2" Value="0.0430739106016" />
<Arrow From="3" To="2" Value="0.0272628871577" />
<Arrow From="0" To="3" Value="0.0355190087615" />
<Arrow From="2" To="3" Value="0.0599855240044" />
<Arrow From="3" To="3" Value="0.0195628760398" />
</Arrows>
<Config ScaleMax="0.0773425122836" /></Graph>
Templates
.xml files can be used as a template for an other graph (File -> use a template). It follows the same structure but will only use data about the position of nodes and labels
Labels
Labels can be imported directly with the (.xml) file or from a .txt file in which each line has the name of a node, in order. (Edit -> Add labels)
Label0

Label1
Display
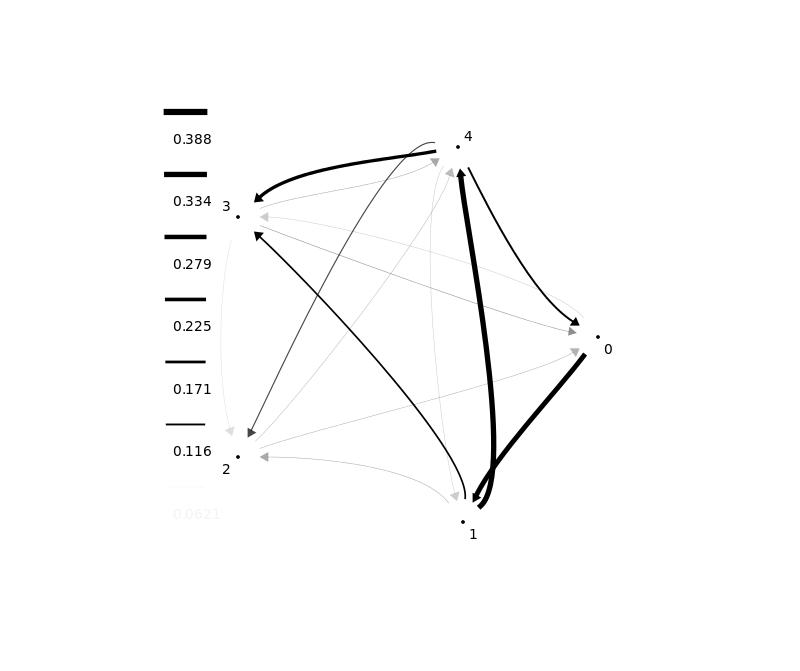
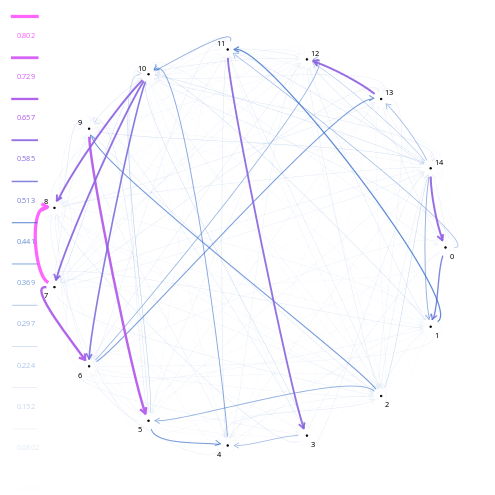
There exists three different display styles : blue-purple, red-green, black. Set the curve value to min to have a straight graph, put it to maximum to have curvy arrows. You can change the thickness of the graph. Increase the "arrows per node" to have more space around nodes to represent the arrows.
Export
You can export your graph to a svg file. Note that you can modify .svg files with a svg editor (e.g Inkscape) to adapt the graph to your needs. A multi-export is available and it generates a report (.htm/.html) with all the image files.
Gallery